
Percentage increase in Excel, with the denominator the right way round
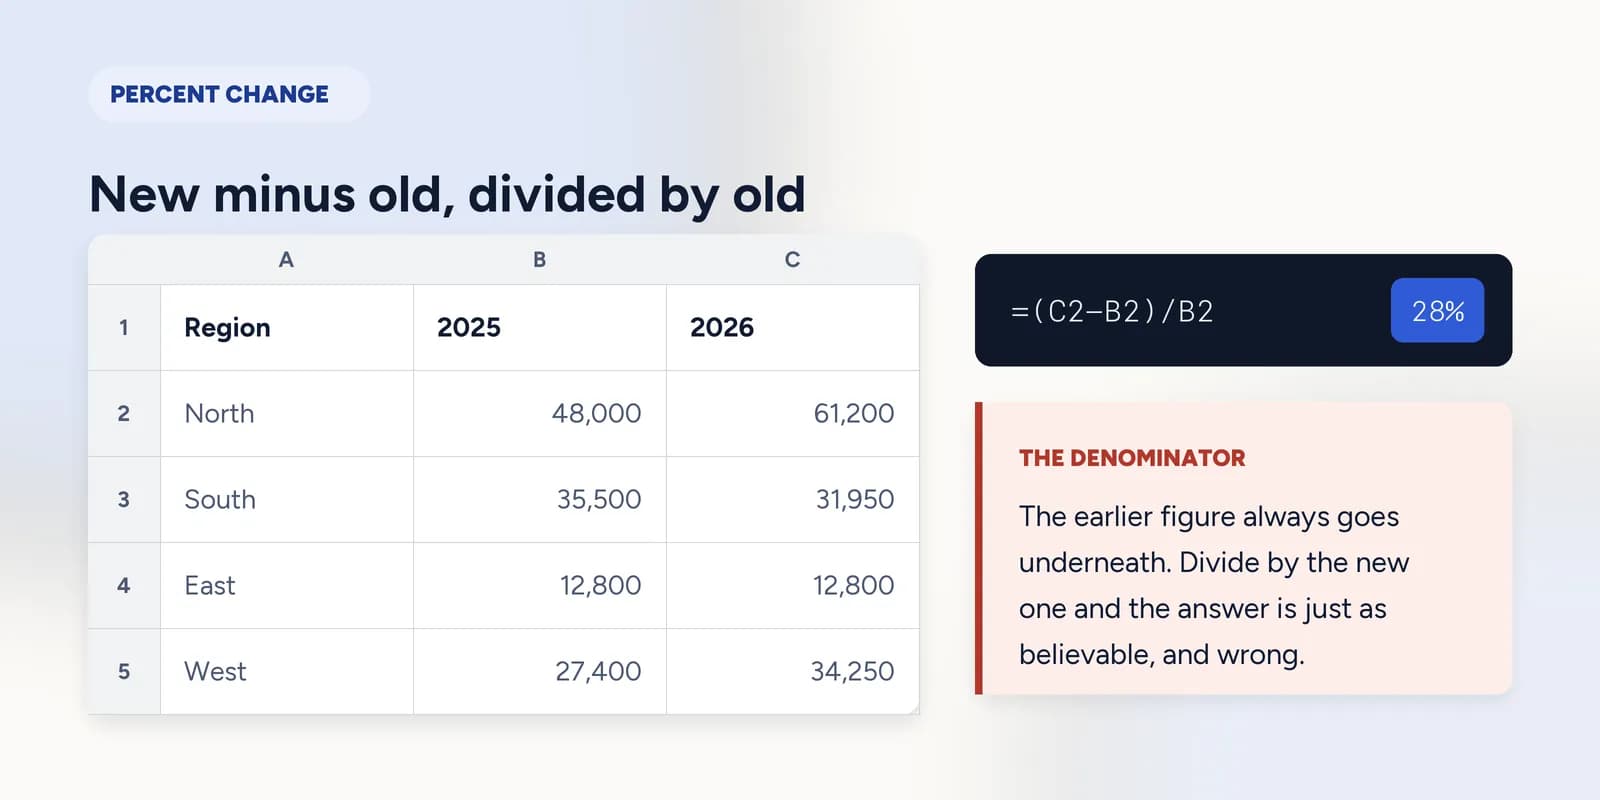
The percentage change between two numbers is =(new-old)/old, so a rise from 48,000 to 61,200 is written =(C2-B2)/B2 and formatted as a percentage. The earlier figure is always the denominator: dividing by the new one instead gives a different number that looks just as plausible and is wrong.

Percentage change is the most-quoted figure in business reporting and one of the easiest to get backwards. Both numbers are in front of you, either order divides cleanly, and nothing about the answer announces which one ended up underneath.
The rule is one sentence: the figure you started from goes on the bottom. Everything else on this page is the handful of cases where that sentence is not enough.
New minus old, over old
Subtract the earlier figure from the later one to get the difference, then divide by the earlier figure to express that difference relative to where you started. Format the cell as a percentage and you are done.
| A | B | C | D | |
|---|---|---|---|---|
| 1 | Region | 2025 | 2026 | Change |
| 2 | North | 48000 | 61200 | 28% |
| 3 | South | 35500 | 31950 | -10% |
| 4 | East | 12800 | 12800 | 0% |
| 5 | West | 27400 | 34250 | 25% |
| 6 | Total | 123700 | 140200 |
=(C2-B2)/B2North: up from 48,000 to 61,200. Formatted as a percentage the cell reads 28%.
=(C3-B3)/B3South fell, so the same formula returns a negative number. There is no separate decrease formula; a decrease is a negative increase.
Formatting, and the hundred that is already there
The formula returns a decimal. 0.275 is twenty-seven and a half per cent, and percentage formatting displays it that way without changing what the cell holds.
If you need the figure as text inside a sentence, TEXT does the formatting and the conversion in one go: TEXT(D2,"0.0%") returns a piece of text such as 27.5% that can be joined to other words. It can no longer be added up, which is the trade.
=TEXT((C2-B2)/B2,"0.0%")The same change as text, ready to be joined into a sentence with an ampersand.
Zero, negatives, and the asymmetry
Three cases break the one-sentence rule, and all three turn up in real data.
- The starting figure is zero. There is no percentage increase from nothing, and the formula correctly returns #DIV/0!. Wrapping it in IFERROR to show a blank is reasonable; replacing it with 100% is not, because that is a number you made up.
- The starting figure is negative. The arithmetic runs and the answer means very little: a move from a loss of 50 to a profit of 50 is not a 200% improvement in any useful sense. Report the absolute change instead.
- A rise and the matching fall are different percentages. From 100 down to 80 is a fall of 20%. From 80 back to 100 is a rise of 25%. Same movement, two numbers, because the denominator changed. Any report quoting both has to say which way round each one is.
=IFERROR((C4-B4)/B4,"")East did not move, so this is zero rather than an error. The IFERROR is there for the rows where last year's figure is genuinely nothing.
The exercise has a row that fell and a row that did not move, so a formula with the denominator the wrong way round fails on something visible rather than passing by luck.
Percentage change between two years
New minus old, divided by old. Get the denominator wrong and every figure in the report is wrong. · 5 min · Paid plan
What goes wrong
These are the four mistakes that come up again and again. Each one is reasonable. That is why people make it.
Dividing by the new figure
WhyBoth numbers are right there and either order produces a plausible percentage. Nothing in the result says which one was underneath.
InsteadThe earlier figure always goes on the bottom. Sanity-check the size: a rise from 48,000 to 61,200 is somewhere near a quarter, not near a fifth.
Multiplying by 100 and formatting as a percentage
WhyThe raw 0.275 looks far too small to be a percentage, so scaling it up feels like the missing step.
InsteadPick one. Either leave the decimal and format the cell, or multiply by 100 and label the column yourself. Doing both gives you 2750%.
Averaging a column of percentage changes
WhyThey are numbers in a column and AVERAGE accepts them without complaint.
InsteadWork the change out from the totals: =(C6-B6)/B6. The average of four regions' growth rates is not the growth rate of the business.
Replacing #DIV/0! with 100%
WhyThe error looks untidy in a report and something grew from nothing, which feels like it ought to be a big number.
InsteadLeave it blank or write new. A percentage of zero has no value, and 100% is a figure nobody can trace back to anything.
Common questions
What is the formula for percentage increase in Excel?
=(new-old)/old, written against cells as =(C2-B2)/B2 and formatted as a percentage. The same formula covers a decrease, which comes out as a negative number.
How do I calculate percentage difference between two numbers in Excel?
=(C2-B2)/B2 gives the change relative to the first figure. If neither is a starting point, divide by the average of the two instead: =(C2-B2)/AVERAGE(B2:C2).
Why does my percentage show as 2750% instead of 27.5%?
The value was multiplied by 100 and then formatted as a percentage, which applies the conversion twice. Remove the multiplication and let the format do it.
What should I do when the starting value is zero?
The formula returns #DIV/0!, which is correct: there is no percentage increase from nothing. Show a blank or the word new. Putting 100% there is inventing a figure.
Why is a 20% fall not reversed by a 20% rise?
Because the second percentage is of a smaller number. 100 less 20% is 80, and 80 plus 20% is 96. Getting back to 100 from 80 takes a rise of 25%.