
Charts, and choosing the shape that tells the truth
The chart type follows from the question. A column chart compares categories and answers which is biggest. A line chart shows change over time and answers which way is this going. A pie chart shows parts of one whole and is only legitimate when the slices genuinely add up to 100% of something.

Choosing a chart looks like a question of taste and is not. Each shape makes a specific claim about the data, and picking the wrong one makes a claim you did not intend and probably cannot support.
There are only three decisions worth agonising over at this level, and they are all answerable by asking what question the chart is supposed to answer out loud before any chart exists.
Three questions, three shapes
| A | B | C | |
|---|---|---|---|
| 1 | Region | Revenue | Share |
| 2 | North | 15700 | 0.4531024531 |
| 3 | South | 7350 | 0.2121212121 |
| 4 | East | 2180 | 0.06291486291 |
| 5 | West | 9420 | 0.2718614719 |
- Which of these is biggest? A column chart. The categories have no natural order, the bars can be sorted largest first, and length is the easiest visual quantity to compare accurately.
- Which way is this going? A line chart, with time along the bottom. The line asserts that the points are connected and that the space between them is meaningful, which is only true for a continuous axis.
- How does this divide up? A pie chart, but only if the parts are parts of one whole and add to 100%.
A line chart with product names along the bottom is the commonest category error. The line implies that the data moves continuously from one product to the next, and products do not have an order, so the slope between two points means nothing at all.
Prove the shares add up first
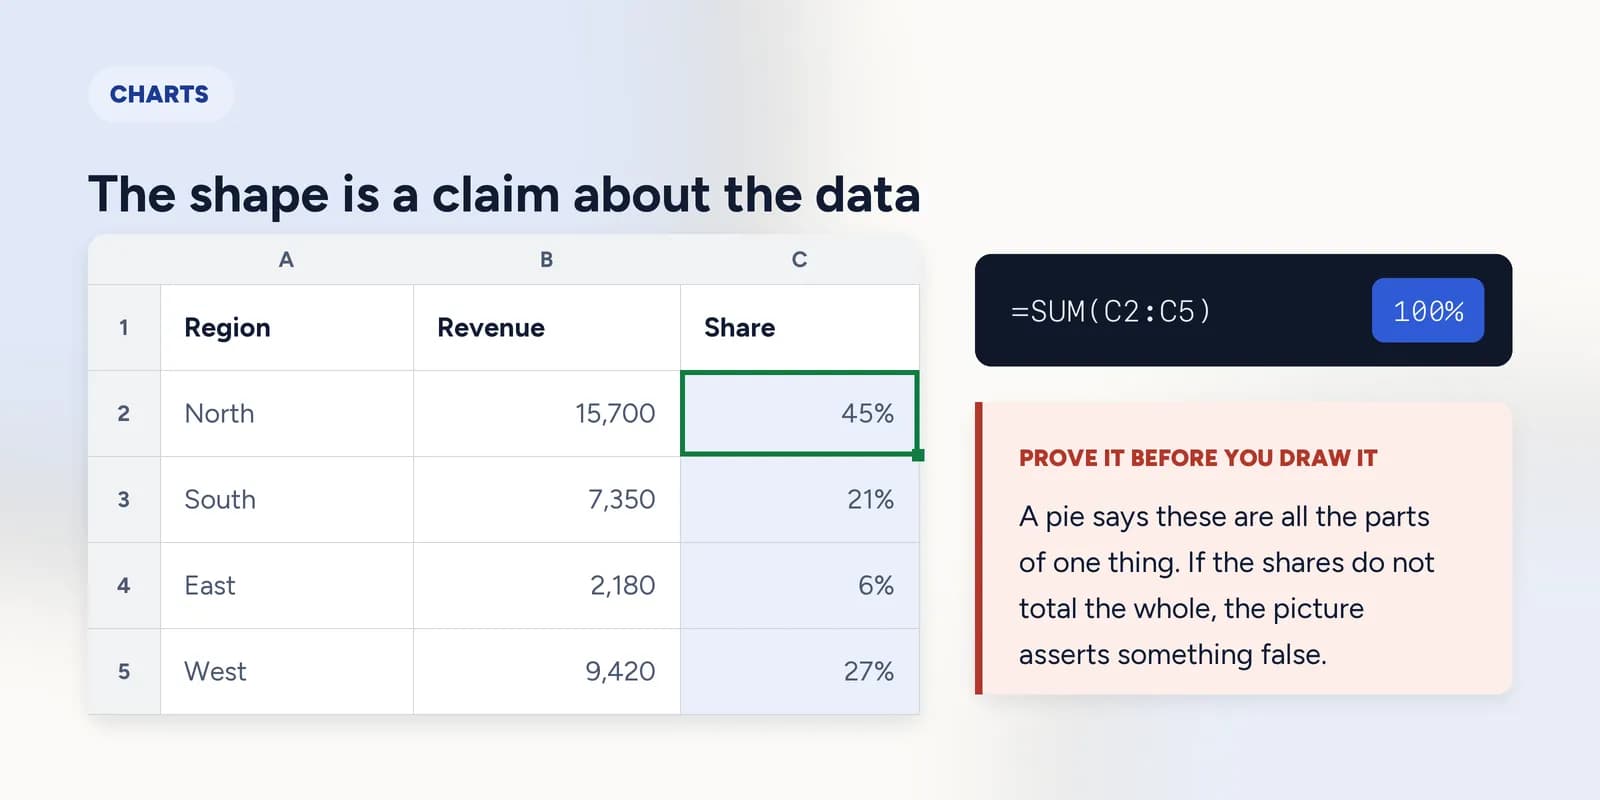
A pie chart says these are all the parts of one thing. If the slices do not add up to the whole, the picture asserts something false, and it does so convincingly because the eye reads a circle as complete by definition.
=SUM(C2:C5)The shares total to exactly 1, so a pie is honest here. Do this arithmetic before drawing the chart rather than after.
Even when a pie is legitimate it is poor at its job past about five slices, because people compare angles badly. A sorted column chart almost always communicates the same data more precisely, which is why so much advice amounts to not using pies.
Two things that mislead without anybody lying
- A vertical axis that does not start at zero. On a column chart this is straightforwardly misleading, because the bars are being compared by length and the lengths are no longer proportional to the values. On a line chart, where the subject is the shape of a change, a truncated axis is often reasonable, and the axis should be labelled clearly either way.
- Too many series. Four lines is a chart; eleven is a plate of spaghetti that hides every one of them. If each series matters, several small charts side by side beat one crowded one.
What goes wrong
These are the mistakes this part exists to prevent. Each one is reasonable, which is why people make it and why nothing on the sheet objects.
Using a line chart for categories
WhyLines look cleaner than bars and the chart draws without complaint whatever is along the bottom.
InsteadA line only for a continuous axis, which in practice means time. For categories, use columns and sort them.
Drawing a pie from figures that are not parts of a whole
WhyAny set of positive numbers can be turned into percentages, and Excel will happily do it.
InsteadAdd the shares up first. If they do not come to 100% of a real total, the data is not pie-shaped.
Letting the chart keep Excel's default title
WhyChart Title is replaced by the series name automatically, which looks like a label and reads as a finished chart.
InsteadWrite the conclusion as the title. If you cannot, work out what the chart is claiming before you put it in front of anybody.
Common questions
Which chart should I use in Excel?
Columns to compare categories, a line for change over time, and a pie only for parts of a single whole. Start from the question the chart has to answer rather than from the gallery of chart types.
When should I use a line chart instead of a bar chart?
When the horizontal axis is continuous, which in practice almost always means time. If the categories could be reordered without losing meaning, the line between them is asserting something false.
Are pie charts bad?
They are poor at precise comparison because people judge angles badly, and they are wrong outright when the slices are not parts of one whole. For a genuine two or three-way split they are fine and immediately readable.
Should a chart axis start at zero?
On a column chart, yes: the bars are compared by length and a truncated axis exaggerates the differences. On a line chart showing change, starting above zero is often reasonable, as long as the axis is clearly labelled.