
Describing a column honestly
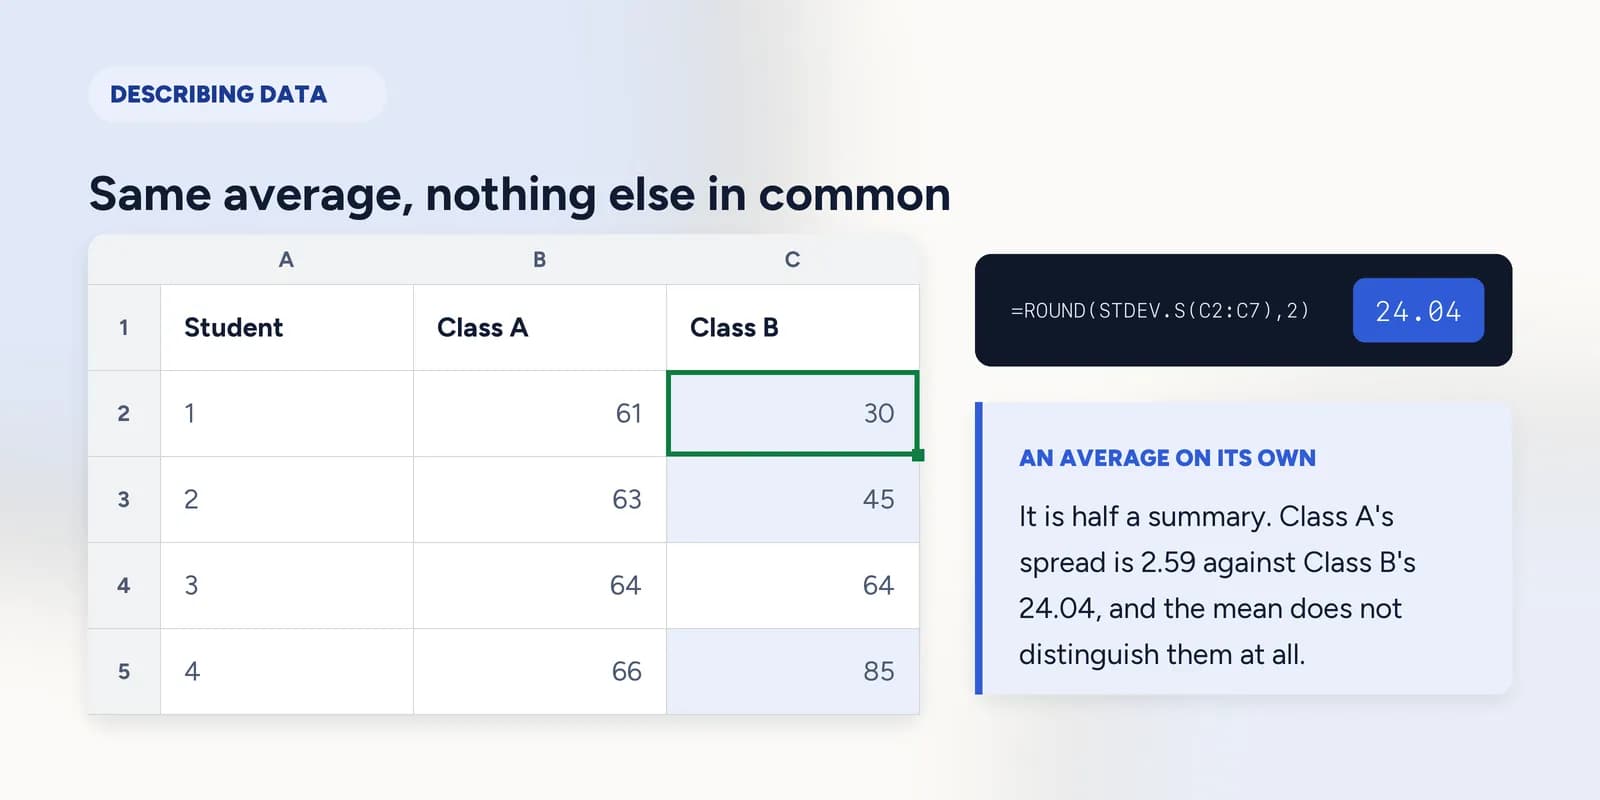
An average with no measure of spread beside it is half a summary. Two sets of marks can share a mean of 64 and describe completely different classes: one where everybody scored in the low sixties and one running from 30 to 96. The mean says where the middle is; the standard deviation or the quartiles say whether anybody is actually near it.

Every exercise in this part has a right answer that is a number and a point that is not. The arithmetic is one function call. The judgement is deciding which number to quote and what has to sit next to it.
The single most useful habit here is refusing to report an average on its own. It takes one more formula and it is the difference between a summary and a summary somebody can act on.
When the mean and the median disagree
The mean is the total shared out equally. The median is the value in the middle once everything is in order. On symmetric data they are close together and either will do. When they separate, the gap is itself the finding.
| A | B | C | |
|---|---|---|---|
| 1 | Student | Class A | Class B |
| 2 | 1 | 61 | 30 |
| 3 | 2 | 63 | 45 |
| 4 | 3 | 64 | 64 |
| 5 | 4 | 66 | 85 |
| 6 | 5 | 68 | 96 |
| 7 | 6 | 62 | 64 |
=AVERAGE(B2:B7)Class A: six marks clustered in the low sixties.
=AVERAGE(C2:C7)Class B: the identical average, from marks running between 30 and 96.
Reported as an average, those two classes are the same class. They are not. One teacher has a group moving together and the other has two groups in one room, and the mean on its own hides that completely.
One value moves the mean and not the median
The mean uses every value, so a single extreme figure drags it. The median only cares about position, so an extreme value moves it by at most one place in the order. That is the whole argument for the median on skewed data.
=MEDIAN(C2:C7)Class B's median is 64, the same as its mean here. Change the top mark from 96 to 200 and the mean jumps while this stays exactly where it is.
Spread: range, standard deviation, quartiles
Three measures, in increasing order of usefulness. The range is the largest minus the smallest, which is one subtraction and is entirely determined by the two most unusual values in the set. The standard deviation is the typical distance from the mean. The quartiles cut the data into four and tell you where the middle half sits.
=ROUND(STDEV.S(B2:B7),2)Class A: a typical mark is about two and a half points from the average.
=ROUND(STDEV.S(C2:C7),2)Class B: ten times the spread on the same average. One number, and the two classes stop looking alike.
Quartiles are often the most honest summary of the three, because the middle half of the data is where most of your customers, students or orders actually are. Quoting the first and third quartile says where the ordinary cases fall without an extreme value at either end having a vote.
What goes wrong
These are the mistakes this part exists to prevent. Each one is reasonable, which is why people make it and why nothing on the sheet objects.
Reporting an average with nothing beside it
WhyIt is one number, it fits in a sentence, and it is what everybody asks for.
InsteadPut the median or the standard deviation next to it. If they disagree with the mean, that disagreement is the more interesting finding.
Using the mean on visibly skewed data
WhyAVERAGE is the function everybody knows, and the result is a real number calculated correctly.
InsteadUse the median when a few large values are pulling the figure away from the typical case, and say which one you quoted.
Using STDEV.P because the name sounds more complete
WhyPopulation sounds like all the data, and the data in front of you is all the data you have.
InsteadSTDEV.S unless the rows genuinely are the entire population. Having all the rows you collected is not the same as having every case that exists.
Common questions
What is the difference between mean and median in Excel?
AVERAGE gives the mean, the total divided by the count. MEDIAN gives the middle value in order. They separate when the data is skewed, and the size of the gap tells you how skewed it is.
When should I use the median instead of the average?
When a few extreme values are dragging the mean away from the typical case: incomes, house prices, order values. Quote both if you can, because the difference between them is informative.
What is the difference between STDEV.S and STDEV.P in Excel?
STDEV.S treats the data as a sample of something larger and divides by n-1. STDEV.P treats it as the whole population and divides by n. Use STDEV.S unless your rows genuinely are every case that exists.
How do I calculate quartiles in Excel?
=QUARTILE.INC(range, 1) gives the first quartile and 3 gives the third. The gap between them is the interquartile range, which is where the middle half of the data sits.
Why do two columns with the same average look completely different?
Because the mean says nothing about spread. One column can cluster tightly around the average while another runs from one extreme to the other. The standard deviation or the quartiles is what separates them.